Here’s How I Increased Event Registrations by 28%
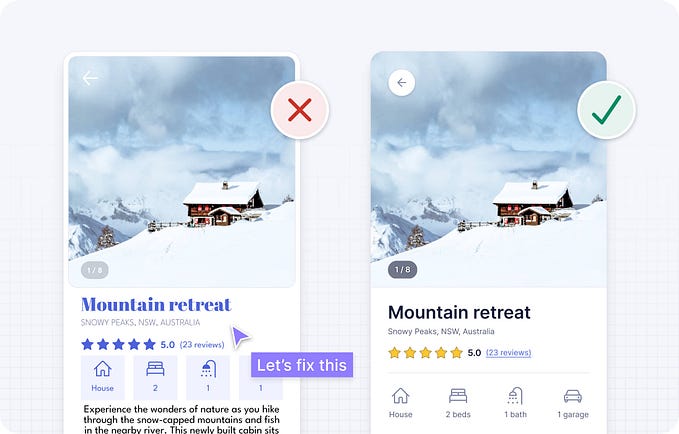
Using minor UX enhancements, I was able to boost the amount of people registering for the event. This is one of my most treasured use cases.

Digital Workplace Day Tweetathon, was the first-ever 24-hour conversation around the most important aspects of the digital workplace. It was a high-profile event that brought together CEOs from a variety of industries. The purpose of the event was to demonstrate what Digital Workplace is all about, what its benefits are, and how it is the next step for any business looking to simplify their work processes in the digital age.
We weren’t able to commit as much attention to user experience in the beginning of the project due to time restrictions, so we had to proceed with the launch.
When I entered the picture, things became interesting.
Initially, I focused on two key activities:
1. I performed a routine usability evaluation across all pages to verify there were no problems.
2. Second, optimising for event registrations is a vital component of the overall strategy.
This wasn’t like any other endeavour where I could take my time to gather information and get insights. Because the duration of this event was just 24 hours, I had to be on my toes at all times.
I’ll go through each step I took to achieve our objective with you in great detail, so pay close attention. Just to remind you, the processes may seem to be lengthy and time-consuming, but I completed them in less than a day, which implies you can do the same in less time.
What I did:
Discovering and ideating | Prototyping| Data Analysis and Evaluation.
Phase #1: Probe & Learn
1. Heatmaps and Session Recordings
The moment the event was released, I began monitoring Mouseflow session records in order to determine how people were doing and where they were having difficulty or becoming confused. I was responsible for keeping a close eye on our present design and identifying its advantages and disadvantages. Here’s what I was searching for while I was out and about:
- Approximately how many people went down the page and at what point on the page did they scroll
- What were the most often encountered registration patterns?
- What was preventing folks from registering?
With the use of heat maps and scroll maps, I was able to uncover even more interesting information.
2. Analytics Review
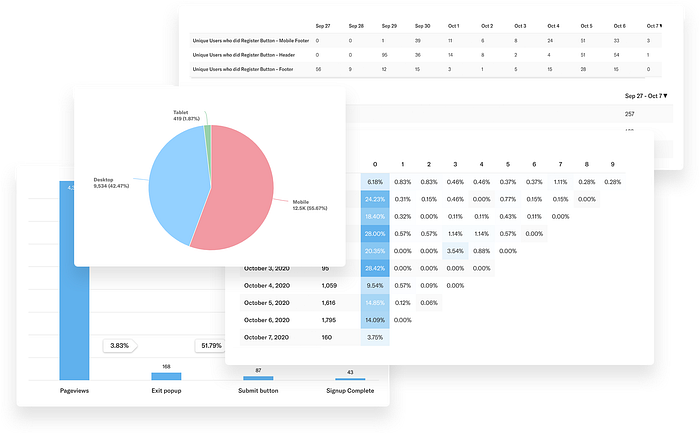
To find out more information about the page, I combined Google Analytics and Heap to find out data pointers such as Google Analytics to get more insights about the page such as audience, channel, device breakup, traffic, region, etc.
With Heap, where I had previously specified a collection of reports and events that I wanted to keep track of, including:
- The number of people that have signed up
- The total number of CTA clicks
- What were the most often encountered registration patterns?
- Registration by Device breakup
- Exit rate
- Visitors who are new vs returning, as well as a cohort report
In addition, I had employed analytics to derive quantitative insights from the qualitative insights we had discovered.

Shared insights
All of the information was produced and disseminated via the use of a Google presentation. I presented information that went beyond simple figures and included user recordings as well as heat maps, among other things. Rather of having to look at the issue just through the lens of data, the stakeholders were able to see the dissatisfaction from the viewpoint of the users. It demonstrated to them how the issues detected may have an effect on their prospective consumers, not just on conversion rates, but also on their perception of the brand itself.
Key Insights
- When comparing mobile registrations to desktop registrations, I discovered that roughly 60% of users were registering on mobile devices.
- We had not considered the user experience on mobile devices while designing the website. As a result, we were missing chances to improve registration as a result of this.
- The majority of the visitors were scrolling down and across sites in a substantial amount of time.
- I discovered that a considerable percentage of individuals were returning to the website after seeing it the first time.
Phase #2: Goal Defintion
Goal: Increase the number of people who signup/register to the event.
Hypotheses
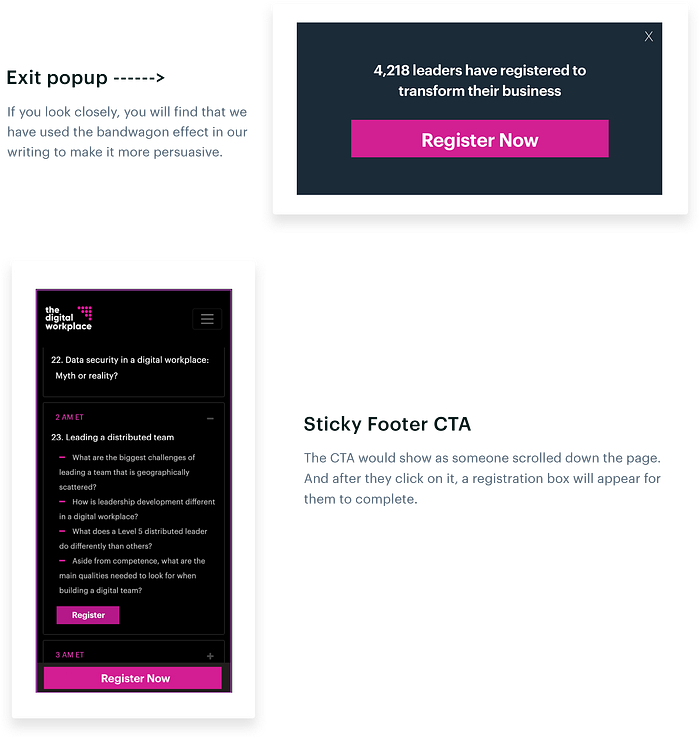
- Instead of consumers having to scroll all the way down to the header or footer to register for the event, placing the Footer sticky CTA would make it much simpler for them to do so.
- Exit popup approach — by presenting a popup to those who are exiting without registering, we want to increase the number of people who register. I had also considered the bandwagon effect while creating my design.
Metric
Iterations were driven by quantifiable fundamental objectives, which were augmented with one-off goals that were specific to each iteration.
The most important metric is registration.
Phase #3: Collaborate & build
Phase #4: Observe and implement
1. Heat Maps, Session Recordings and KPI Metrics
Following the debut of the product. Heatmaps and session recordings assisted in identifying areas of the design that performed well and possibilities for iterative testing to be carried out. In addition, the design team was responsible for keeping an eye out for user interface (UI) concerns such as responsiveness and reporting them to the technical team so that they could be resolved quickly. This was the most important activity among the whole group.
In addition to this, I was actively evaluating how well my hypothesis was functioning and what further enhancements we might make to ensure that we reached our target on time.
The Payoff
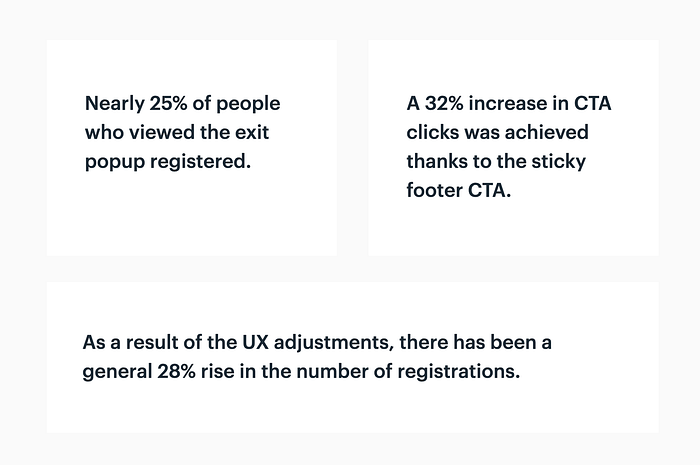
What exactly does this imply?
…..If you are an event organiser, I strongly advise you to collaborate with an UX professional both before and after the launch of your event.
….
If you are an UX professional, please step up your game and collaborate with the event team to assist them reach their objectives.
And finally if your marketer who want to learn more about how UX influences various aspects of your team, check out this article →
https://bootcamp.uxdesign.cc/what-the-heck-is-marketing-ux-9b025f107a52.html.