How to clean AB testing data before analysis

After a sufficient amount of data collected and AB test completed, some of you might think it’s time for data analysis, but before we start to analyze we need to ETL the data.
ETL stands for Extract, Transform, Load. In this article, we will talk about the transform part, which is in our case cleaning. Often the collected data contains outliers, and let’s say, if we want to apply a parametric method to compare means, then this method requires robust data.
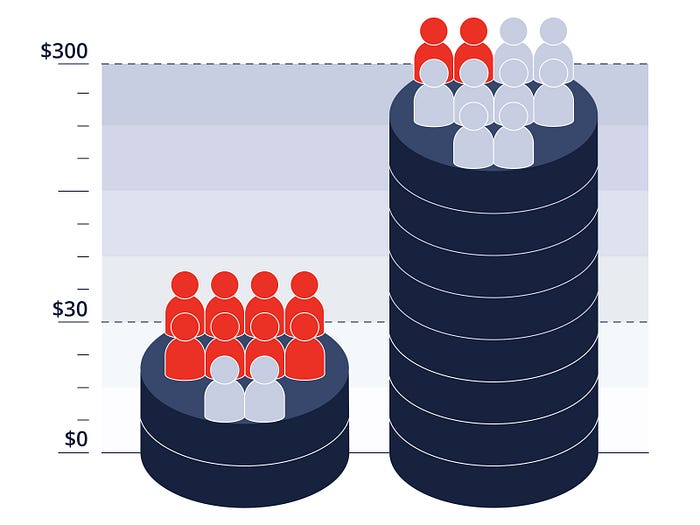
Let’s talk about an experiment with “average check” metric. In the average check dataset, we want to find mean value. In this case, outliers could have a significant influence on our mean value. Let’s say if the average check of a regular customer is $30, but there are customers who typically spend $300, the mean value will be skewed. One of the options is to find and remove the outliers from the dataset manually. Sounds easy, right? However, the challenge is if our dataset contains millions of observations.

Obviously, we have many outliers in this dataset. Most likely, these outliers are the clients who spent significantly more as compared to an average customer, these are also known as so-called “whales”. These users may generate a significant revenue share, and they must be analyzed separately, and one of the reason is that their behavioral patterns are most likely to differ. We’ll uncover this topic in future posts. So, how do we deal with such a dataset, to stabilize and clean the outliers?
One of the options that come to mind is to get rid of values outside of three standard deviations from the mean.
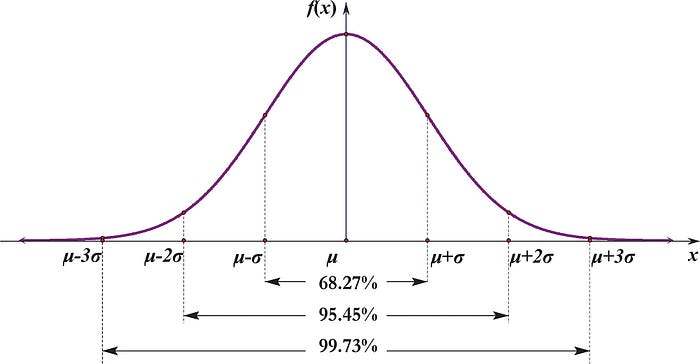
Let’s delve a little bit into the theory. Three sigma rule — almost all values of a normally distributed random variable lie within (x̅-3σ; x̅+3σ). With a probability 0.9973, the value of a normally distributed random variable lies in the specified interval (if the value is not obtained as a result of sampling).

Graph of the probability density of a normal distribution
We can use the following function in R language to exclude all those data that lies outside of three standard deviations from the mean.
outliers.rm <- function(x){
      return(x[abs(x - (quantile(x, 0.25) + quantile(x, 0.75))/2) <= 2*IQR(x)])
}
After applying this function, you will clean a significant amount of outliers in your dataset. Worth to note though, that you should use this method very carefully because it can remove too much data in your sample. This number could be %30 or even more.
There are many more data cleaning approaches. In this article, we have reviewed only one of them which is pretty simple and quite popular.
In practice, a data cleaning method depends on the data quality and nature. Couple less conservative methods to mention the Box-Cox transformation or methods using the median to compare samples, such as Kruskal-Wallis criterion. We will discover other data cleaning methods in the coming articles.
Originally published at awsmd.com.


