
As I worked on a personal project to redesign a mental health youth support website, I found that it wasn’t difficult to generate ideas. The difficulty lies in generating good ideas and assessing them.
How do I prioritise one idea over another? Is there a systematic way of assessing which ideas to prioritise?
With that in mind, I sought out structured frameworks that are commonly used by product managers to prioritise features.
The right framework would help to answer the following questions:
- Does this feature drive the highest business value/social impact value?
- Is this feature delivering value to customers?
- Does this feature contribute to the broader business objectives?
- What will it take to launch this feature?
Red Routes Analysis
While it is not exactly a framework for feature prioritisation, a red route analysis reveals which user flows are the most important to primary users and what user needs should be prioritised.
What are red routes?
First introduced in London in 1991, red routes are major roads on which vehicles are not allowed to stop. They make up London’s roads, but carry up to 30% of the city’s traffic. the goal is to reduce congestion on these roads with high traffic volumes.
In design, red routes are the critical and frequent paths that users take to complete their tasks.
Red routes tend to be crucial, end-to-end tasks with multiple steps or actions (such as the registration process), frequently utilised. in addition, they drive key business metrics and have a huge impact on user experience.

Identifying red routes helps the team to prioritise user needs and avoid the introduction of ancillary features that do little to fulfill user needs.
Kano Model
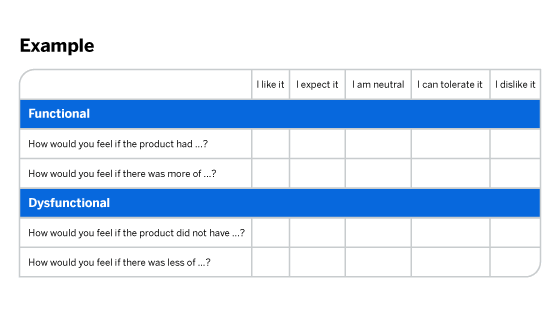
Developed in the 1980s by Japanese educator Noriaki Kano, the Kano model is a theory for product development and customer satisfaction which classifies customer preferences in 5 categories.
The Kano Model answers the following questions:
- How can we measure customer satisfaction?
- Do current features result in high customer satisfaction?
- How can features be enhanced to increase customer satisfaction?

The three categories that a product or service should strive to achieve are:
- Must-be qualities (Mandatory)
These are basic features that customers expect a product or service to have. If such features are absent, customers will be extremely dissatisfied. However, customers are neutral about them when they are present. Their presence will not add more satisfaction.
Example: A customer expects a restaurant to be clean and hygienic.
2. One-dimensional qualities (Performance)
These are features that are desired by customers. They result in satisfaction when fulfilled and dissatisfaction when not fulfilled. Customer satisfaction is proportional to the level of fulfillment.
Example: A customer calling a service helpline expects to be attended in less than 5 minutes.
3. Attractive qualities (Delight)
These are features that excite or delight customers, and differentiates the product and service above your competition. These features have the greatest influence on customer satisfaction. However, if they are not met, there is no feeling of dissatisfaction.
Example: Offering a customer a complimentary hotel room upgrade
Measuring customer satisfaction
Kano analysis enables product teams to measure customer satisfaction in a quantitative manner with a standardised questionnaire.
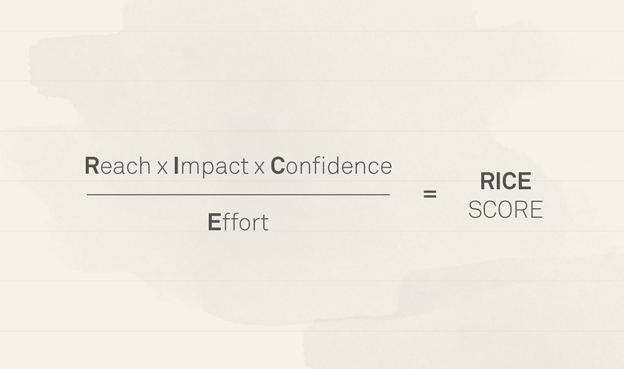
RICE
Intercom, a software company, developed the RICE framework to suit their internal use after testing and iteration. They eventually derived four factors to assess priority.
- Reach
Reach is measured using the number of people/events per time period e.g. customers per quarter or transactions per month. Real measurements from product metrics should be used as much as possible.
2. Impact
How much will this impact each person?
A multiple choice scale is recommended to quantify impact:
Massive = 3x, High = 2x, Medium = 1x, Low = 0.5x, Minimal = 0.25x.
3. Confidence
How confident are you in your estimates? If you think a project has huge impact but lack data to back it up, it is important to be honest at this stage
High = 100%, Medium = 80%, Low = 50%.
4. Effort
How many “person-months” will this take? Estimate the total amount of time a project will require from all teams — product, design engineering. Unlike the other factors, more effort is a bad thing. The goal is to seek maximum impact with the least amount of effort.
Once a numerical value has been derived for each of these factors, combine them into a single score so projects can be compared at a glance. The output value indicates the “total impact per time worked”
MoSCoW method
A prioritisation method developed by Dai Clegg in 1994 and first used extensively in the Dynamic Systems Development Method (DSDM), an agile project delivery framework. It is commonly used in agile software development approaches.
It classifies features into four priority categories to identify what matters most to stakeholders and customers. MoSCoW is an acronym derived from the four categories — Must have, Should have, Could have and Won’t Have.
- Must have
These are the features that have to be present for the product to be functional. they are non-negotiable and essential.
2. Should have
These requirements are important to deliver, but not time sensitive
3. Could have
This is a feature that is neither essential nor important to deliver within a timeframe. They would greatly improve customer satisfaction, but don’t have a great impact if they are left out.
4. Won’t have
These are the least critical features, tasks or requirements (and the first to go when there are resource constraints). These are features that will be considered for future releases.
This certainly isn’t a comprehensive list of prioritisation frameworks and techniques, but some of the commonly used ones. Others include the Value vs Effort method, Opportunity Scoring, Product Tree. They’re not meant to be one-size-fits-all approach. Choose the most suitable one for your project by determining the success metrics, project context and team culture.
Further reading

