Improving information architecture through card sorting
When a person is browsing a website and they can’t find what they want in a few seconds, they’re unlikely to stick around for much longer.
As a result, websites benefit greatly from an intuitive structure and organization. The websites that fail to address the issues with information architecture lose sales as customers grow frustrated and leave.
Information architecture (IA) is the art and science of organization, structuring, and labeling of the information. Its goal is to design an optimal architecture for the information and organize relation between various information elements.
One of the common reasons for having bad IA is when it is created by directly following the business structure of the organization without taking into account the users’ needs. When creating information architecture, designers often make subjective decisions and this often leads to poor solutions.
Without involving users in the process as soon as possible it is hard to create an optimal information architecture. This is where user-centered design technique called card sorting comes into play. It is a method that is used to help determine the information architecture of a digital experience. It provides an understanding of the mental model that users have. By giving them a chance to participate in the creation of categories and labels it exposes the informational structures users think within. It is a great way to get users involved as it is cheap, efficient and easy to set up.

When to use card sorting?
Card sorting is useful for example when you want to:
- find out how customers expect to see information grouped on a website
- organize a complex sitemap
- organize submenus on a website
- classify products in a web-shop
- organize questions in a FAQ
How to do card sorting?
The process is very simple. You write down the elements that you wish to organize onto cards and then ask participants to collect them into groups that make sense to them.
Once the sessions are done, if many users organized the cards in a similar way, it’s just a matter of applying that same organization to your content. On the other hand, if they haven’t organized the cards in a similar way, the goal is to try and figure out organization patterns. Finally, when new information architecture is determined, and if resources allow, it is useful to do a round of user testing to confirm that the new information architecture is superior to the old one.

There are three types of card sorting tests: open, closed and hybrid. Open is when the participant can create categories of her own, or add concepts that are missing. Closed is when the participant is limited to using only the cards provided to her while hybrid begins as a closed card sort, but allows participants to create categories that may be missing from the card deck.
It is possible to use moderated or unmoderated facilitation approach.
The beauty of card sorting is that it doesn’t need advanced technology or software. It’s as simple as writing the items on pieces of paper like post-its or cards, spread them out on a table, and let your users play with them. This method is widely used because being in the same room as your users means it is easy to guide them through the process.
There are also decent online card sorting tools, which allow easier scaling to a higher number of study participants. One of the most popular online tools is OptimalSort (free for card sorting studies with up to 10 participants). There is no much preparation needed and doing statistical analysis is easier. You can also test with remote participants so there is no need to invite people to the office, book meeting rooms etc. The sessions can be run very quickly especially in combination with user recruiting tools like the ones which UserTesting provides. Although, depending on where you are located, this might turn out to be more expensive than user testing with participants in your office. Also, in this case, you lose the personal touch that normally exists when doing sessions face-to-face.
Best practices
- Make sure to find actual users of the website instead of running it with randomly picked participants, especially if it’s a very niche website.
- Ideally, card sorting should be done with 15 or more participants, as noted by Jakob Nielsen. My advice is to first do the card sort with a pilot participant to iron out any potential issues in your plan.
- The interaction with pilot participants can be offline, or online through the remote testing platform (usertesting.com).
- Each session should last 15 to 30 minutes. Set a time limit for each session.
- The exercise should always start with the cards randomly laid out on a table.
- If you are moderating the sessions and participants get stuck, be sure to remind them that there is no right or wrong answer. Also explain to them that this isn’t a problem but is in fact, good feedback as it indicates a problem with labeling that specific card.
Real life example
How to run the study?
With a Fortune 500 client that I worked with, my goal was to improve the user experience of a document printing website. One of the screens was a design builder where users can edit the final design of their document that will be sent to print. The submenu of the design builder included a lot of features and had too complex structure so it’s information hierarchy was to be improved by doing a card sorting study.
The idea was to write down the features from the submenu as cards and have actual users group them into categories. The best fit for this was to use open card sorting because the goal was to find a better naming for categories and we didn’t want to restrict the users to currently used categories. Unmoderated card sorting was fine for this purpose as there was no need for constant moderation during the session.
I created a new study in OptimalSort tool and added all the features as cards.
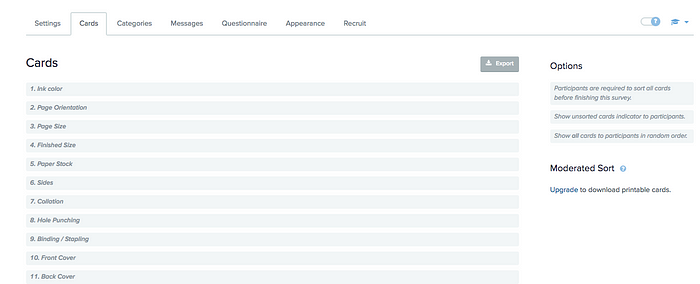
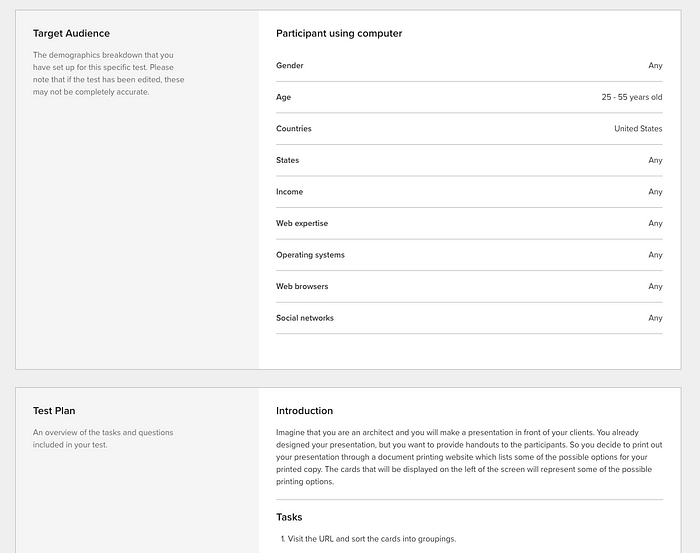
First I did a pilot test with a colleague in the office. She went through the whole task and this was used to check if everything is ok with the study structure so that it can be scaled with more participants. Then I created a new user test at usertesting.com website and I decided to use their own panel of participants to scale the experiment by defining a target audience and a test plan.
What I find useful to include in the card sorting study is this set of questions after the test:
- Which cards were most difficult to sort? Why do you think that is?
- Which cards were difficult to understand?
- Which groups were difficult to name? Which groups were easy to name?
- In general, what are your thoughts on the groupings that you created?
How to interpret the results?
After I ran the study with 20 remote participants through UserTesting platform, it was important to carefully review the results.
As a facilitator I collected two forms of data:
- Qualitative: data which includes participant comments.
- Quantitative: data which includes card sort and category ranking metrics as well as the general frequency of similar terms used.
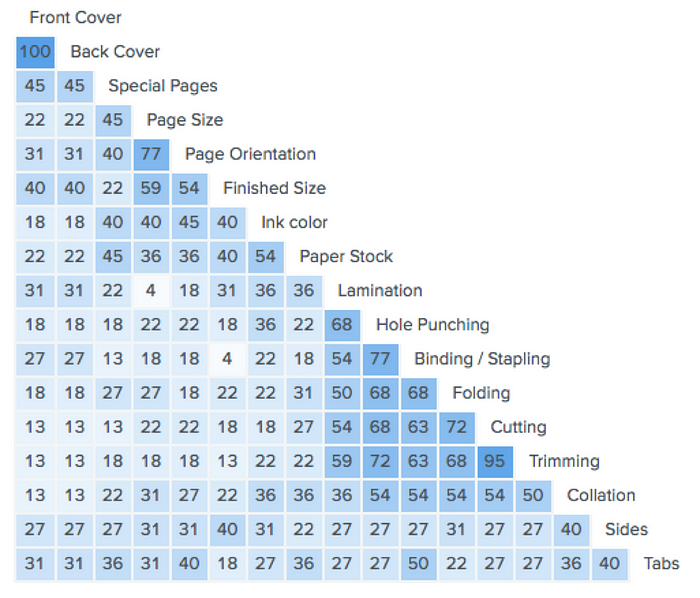
One of the quantitative tools is similarity matrix which can be used to learn how strongly the group elements are related to each other. Each number in the matrix represents the percentage of times that the elements were grouped together with each other.
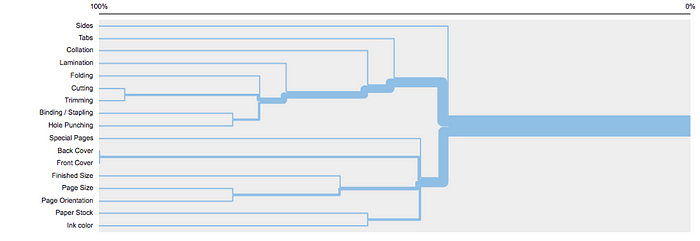
Another useful statistical tool is dendrogram which is used to easily illustrate data clusters. There are two common types, Best Merge and Actual Agreement, but for this study Best Merge method works better as there are less than 30 participants in total. Interpreting the groups in dendrograms is usually subjective in situations when there isn’t high agreement between users, like in this case.
By using dendrogram in this case the results showed that:
- Lamination, Folding, Cutting, Trimming, Binding/Stapling and Hole Punching belong to Binding/Appearance category
- Collation, Tabs and Sides didn’t have a common pattern for a specific category.
- Special pages, Back cover, Front cover, Finished size, Page size, Page orientation, Paper Stock and Ink Color belong to Covers/Pages category.
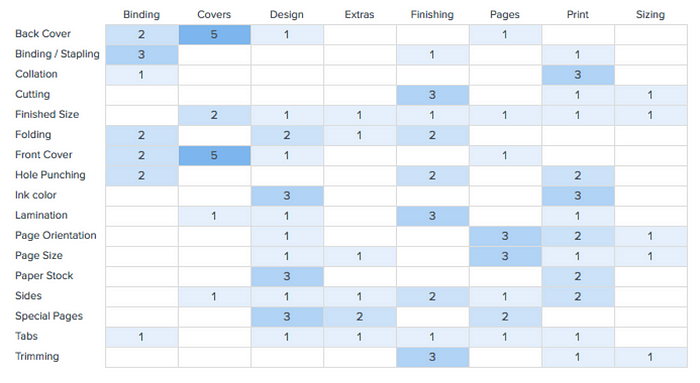
It is very useful to use a standardization grid when doing an open card sort. As each participant can give a unique name to their categories, the goal is to standardize categories (which means merging categories with similar names and cards into one). Once that is done, the categories will be put on the grid, along with information on how many times each card was placed within it.
After reviewing the standardization grid, some of the findings were:
- Ink color, Paper Stock and Special Pages belong to Design category
- Cutting, Trimming and Lamination belong to Finishing category
- Page Orientation and Page Size belong to Pages category
- Ink Color and Collation belong to Print category
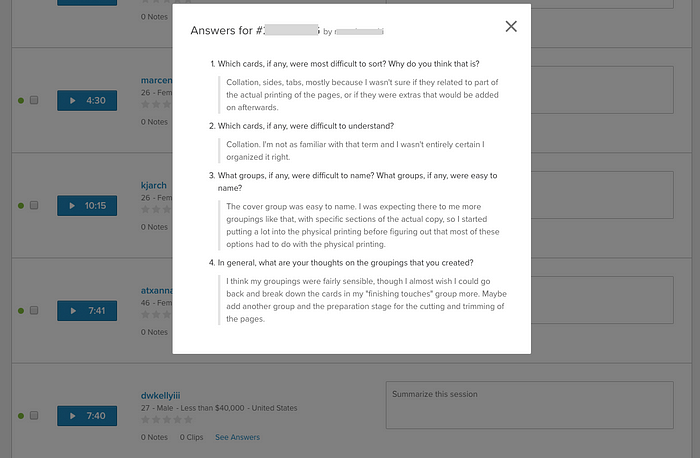
We finally switch to qualitative data and analyze questionnaire responses:
- Tabs, Sides and Collation were the most difficult terms to sort and group, while Sides and collation were the most difficult terms to understand. Different names can possibly be used for these terms.
- Separating the groups into steps could make sense, as well as dividing the group Finishing into more subgroups.
Taking all of the quantitative data (gathered through statistical analysis) into account and merging that with qualitative data (comments recorded during the sessions and feedback given after the sessions), I came up with the new information architecture. To validate the new information architecture, the new variation was A/B tested.
Conclusion
Card sorting has proven to be a very useful technique as you get to hear a very specific feedback about information architecture, directly from your users. Also, doing it remote has cut the total time that takes to interpret the data because of integrated statistical tools.
It is about time that you consider using card sorting on your next project to gain a deeper understanding of the audience’s mental model, which will ultimately help you design a better product.