Space, 🌏Earth & Design
Design is about solving problems beautifully.
Everyone knows how earth and space are related if not then go and see cosmos 😉(carl sagan was a wonderful speaker). But I was thinking about how everything is well designed on earth and how everything is balanced and how humans can use this vast resource “Space” to overcome the coming threat of climate change and many more.
For that few companies are working on solving earth’s problems created by humans with the help of space. SpaceX, Blue origin, etc are doing great for the future but few other companies are using space to solve current life threats like climate change, forest fires, pollutions, etc.
Few believed that climate change is not true but believe me it’s happening, so to tackle these problems companies like Descarte labs, Spaceknow, planet, Onesoil, are coming with amazing solutions with generating jobs and creating a business out of it too.

So how these companies are involved in this cycle of Space, Earth, and Design and solving earth’s problem with the help of Design and Space.

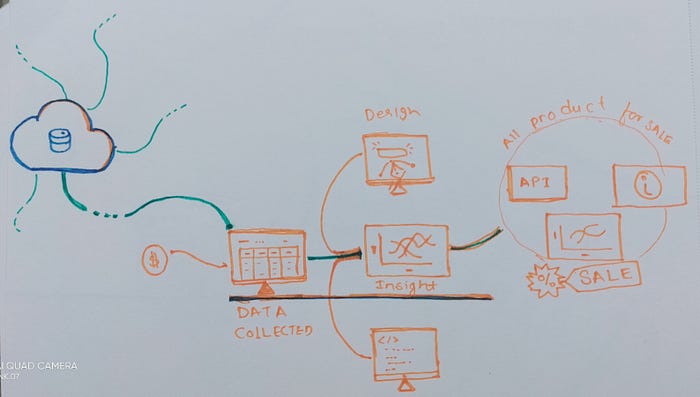
This cycle has three parts: collect, analyze and application. Collect is the part where satellites collect lots of images and data of earth and store them securely on earth in raw formats. Analyse is the stage where all those collected raw imagery and data have taken in and analyzed, then according to their Applications products are made which are used by different customers.
So where does design come in action? How does this business work and money is made out of this? Where can we apply these? How can we fight climate change with this? These are questions that arise, for which we need to understand parts of this cycle of Space, Earth, and Design in detail.
🗑 Collect:

Different types of satellites are launched and controlled by governments and different companies like NASA, Digital globe(is in satellite imagery, geospatial information, and location-based intelligence), Planet, Copernicus masters, ESA, etc who have collected 100s of 1000s terabytes of raw data of the earth. If we want to make sense of these data we need to wrangle data. (Data wrangling, sometimes referred to as data munging, is the process of transforming and mapping data from one “raw” data form into another format with the intent of making it more appropriate and valuable for a variety of downstream purposes such as analytics)
📈 Analyze:
Let’s take a company like Onesoil who mainly deals with farms that need only those data that is related to fields, farms, weather, etc but as the collected data is raw which has much other information which is useless to them. For that data, wrangling needs to be done by Onesoil and then they train their AI/model according to that data. After that these models are connected with Interfaces to make it usable for farmers which is the Application part. Which is why we can say Onesoil as product-based.
But few companies(Service-based) perform only Analyse for others like Descartes Labs, Spaceknow, Aremet Energy, Space-Eyes and many more.
“A scientist who works in satellite data probably spends 80% of their time wrangling data and cleaning it up.
- Mark Johnson, Founder and CEO at Descartes Labs “
To Analyze, companies focus on where to, what to look for and how to analyze the data? How to both train their models and then validate whether you did a great job?
As these days all entrepreneurs, investors, CEOs and everyone says
“Data is the new oil” [4]
Data provide you with a certain amount of insights with the help of those insights the user/person can take more precise and accurate action which can play more role in decision making. Companies use “Geospatial data refinery” for all these processes to simplify.
💡 Application:

All those well-refined data can be converted into business mainly in two ways:
1. Directly selling data in the form of APIs(eg. Descartes Labs), or
2. Develop products that run on collected data(eg. Onesoil).
Other options are, Consultation or suggestion based on data, creating accurate reports by govt. Like USDA predicts corn production every year with less than 1% error of the total production in the United States which is 15 billion bushels produced every year.
As we understand how all this process working, now we can discuss the design and how design plays a very important role? As all relevant data are collected according to stakeholders but they do not understand all those refined data, latitude, longitude, numbers, etc for them we need to present those data in such a format that they can easily understand and get an insight, on which they can take action. Let’s take the example of Onesoil-Explore again…

This interface can be used by anyone to understand about Crops. How to design for data visualization? is another important part which I will cover in the next story. Till then you can explore Spaceknow which shows how they use images to count cars in Disneyland

Feel free to 🧨comment and share your thought. Like this article then give
👏50 Claps.
References:
1.https://www.youtube.com/watch?v=4FC41n9sCKM
2.http://www.spaceknow.com/
3.https://www.descarteslabs.com/
4.https://www.youtube.com/watch?v=iWcS-eY2Jds
5.https://www.descarteslabs.com/
6.https://blog.onesoil.ai/en/how-onesoil-calculates-variable-rate-phosphorus-and-potassium