Top Things to Know About UX Competitive Analysis
One of the critical steps when developing a new product is finding out where you stand with the competition. Competitive analysis is a necessary part of the design process to help businesses gain valuable insight into the market, identify the strengths and weaknesses of their products, and develop effective product strategies to create winning results. So how do you know if your product has that competitive edge? Start by simply looking at your competitors. Here’s what you need to know UX competitive analysis, how to conduct it, and types of frameworks to use during the process.
Why Conduct Competitive Analysis in UX Design?
Performing a competitive analysis in UX design helps companies identify competitors’ strengths and weaknesses relative to their own business, product, and design. The insight designers gain through competitive analysis research helps you develop better products and more effective UX designs. Learning more about your competition helps businesses to:
- Assess where your product or design stands in the market
- Define any gaps in the market
- Know the strengths and weaknesses of your competition
- Identify the advantages and disadvantages of your products
- Have evidence to back up your design changes
- Helps you solve usability issues
- Enables you to develop your go-to-market strategy
When Should You Do a Competitive Analysis?
Performing a competitive analysis should be one of the earliest research steps in the UX design process. Competitive analysis should begin before working on a new design and continue for the project’s duration since new competition may emerge and market conditions will continue to change throughout the design process.
Steps to Do a UX Competitive Analysis
To get started on your UX competitive analysis, define your goals, access the competition, and start comparing products with these steps:
1. Outline your goals and define your product. Ask yourself, why are you doing this competitor analysis and what do you hope to achieve? Be specific in your goal and design focus to keep your analysis on track.
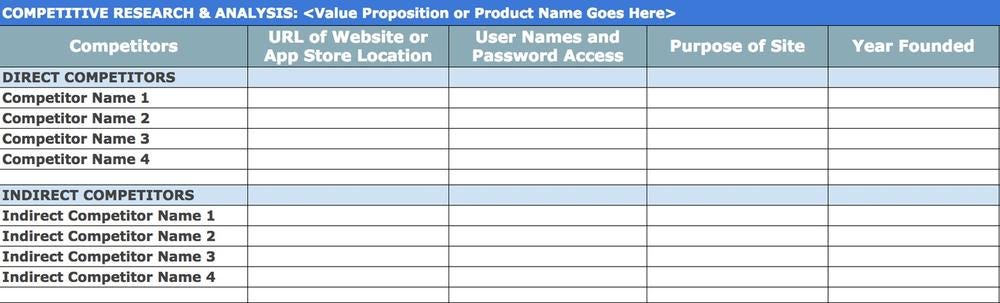
2. Compile a list of your direct and indirect competition. Create a table with 5 to 10 direct and indirect competitors. Categorize them based on priority in this order:
- Direct competition: These companies offer the same products and services at similar price points to satisfy customers’ needs.
- Indirect competition: These companies offer different products or services in the same market that can potentially satisfy the same need.
3. Create a comparison chart of the competitions’ product features. Include a list of features and other UX elements that would be most useful to consumers using your product including:
- User interface
- Images
- Filters
- Sorting
- Load time
- Responsiveness
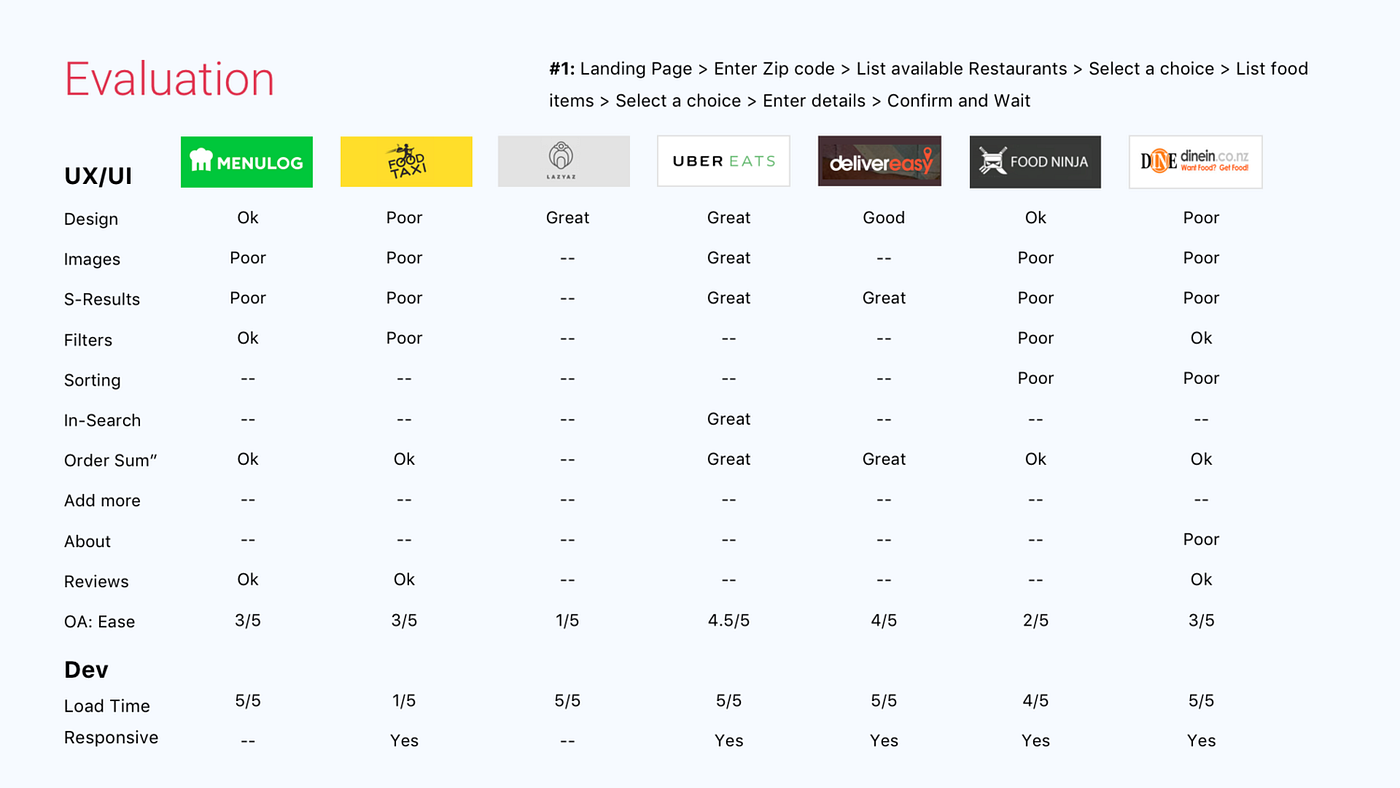
4. Identify the differences between products. Use the comparison chart to identify the differences between your product and the competitors’ products.
5. Summarize and present your findings. After you have completed your research, present your findings to stakeholders to assess your design decision and product strategies. Use visual elements in your competitive analysis to make your report easier to understand.
UX Competitive Analysis Frameworks
UX designers should be familiar with different research methods to better shape their design strategies, according to Kim Kosaka, director of marketing at Alexa, in her article, “5 Competitive Analysis Frameworks Explained with Visuals.” Here are a few popular frameworks that UX designers can use as part of their competitive analysis:
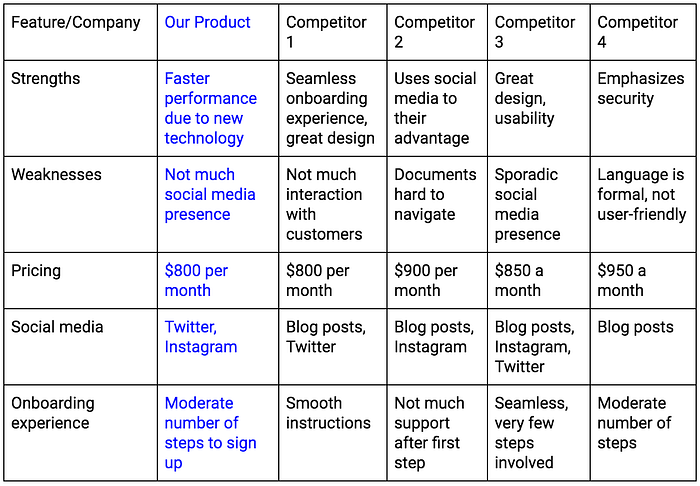
SWOT
SWOT is a strategic planning method based on four elements — strengths, weaknesses, opportunities, and threats. The SWOT framework helps you evaluate the internal (strengths and weaknesses) and external factors (opportunities and threats) that impact your products or design decisions.
SWOT is often used in strategic planning to help identify a potential competitive advantage. It’s a popular method in UX competitive analysis because it can quickly reveal product issues and determine a course of action.
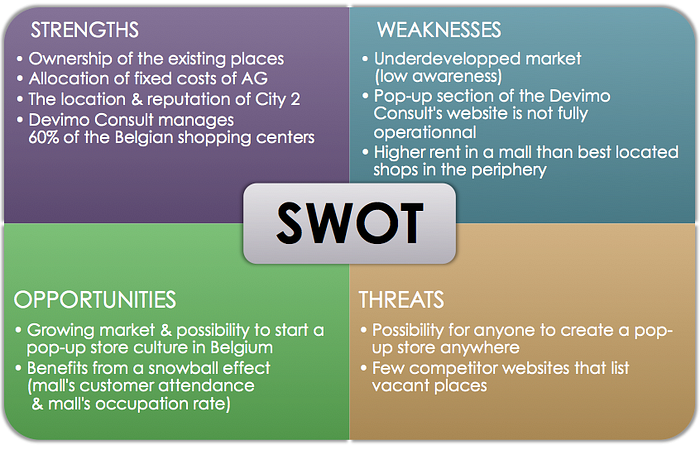
SWOT analysis is a highly functional tool for competitive analysis but does have the potential to oversimplify factors that are limited to the four categories. Without further data research and analysis, SWOT may impact the quality of the analysis.
Growth-Share Matrix
Created by Boston Consulting Group, the BCG growth-share matrix is a business tool that uses relative market share and industry growth rate factors to evaluate the business portfolio and investment strategies. It consists of four quadrants with symbols that represent a certain degree of profitability:
- Dogs. Operating in a slowly growing market, dogs hold low market share compared to the competitors.
- Cash cows. Cash cows are the most profitable brands, which should be “milked” to provide as much cash as possible.
- Stars. As both cash generators and cash users, stars operate in high-growth industries and maintain high market share.
- Question marks. Brands that are question marks require closer consideration as they hold low market share in fast-growing markets, consuming large amounts of cash and incurring losses.
This competitive analysis framework is useful in helping businesses determine their product portfolios; however, this type of competitive analysis provides little information on how to evaluate product strategies across all brands and segments.
Porter’s Five Forces
Porter’s five forces is a framework that helps businesses analyze the industry competitive according to five elements: buyers, suppliers, substitutes, competitive rivalry, and new entrants. According to Michael Porter’s model, these are the key elements that directly affect how much competition your business is up against in the industry.
This UX competitive analysis tool is helpful in planning and gauging the competition; however, it only provides a checklist of external forces that can be beneficial or harmful to a business and assumes a relatively static market structure. Similar to SWOT, the one-dimensional framework requires further analysis for deeper insights.
Perceptual Mapping
A perceptual map, also referred to as a position map, is a visual representation of customers’ perceptions of your product relative to the competition. A perceptual map is a useful tool to help companies assess what your customers think about you and your competitors. This can help businesses track market trends, identify gaps in the market, and develop branding and marketing strategies.
A perceptual map is generally set against two axes and that move from low-to-high to assess certain factors such as price vs. performance, functionality vs. price, or price vs. quality:
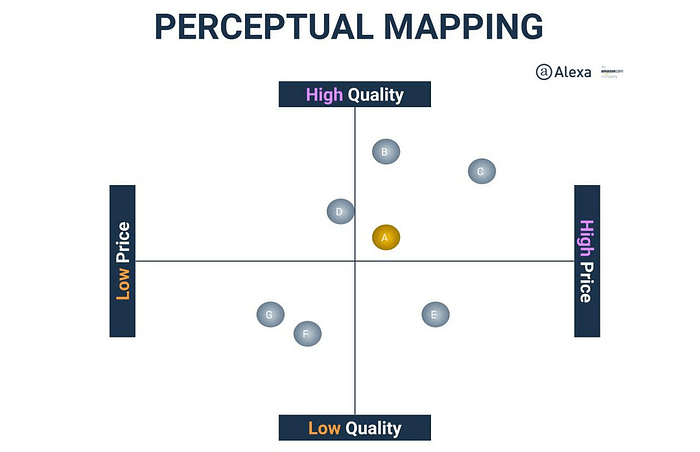
One of the disadvantages of perceptual mapping is that you are limited to two variables so you cannot account for other factors. This method simplifies the customer’s purchase decision down to two attributes. Data may also be more difficult to obtain for the analysis and cost more than other methods.
Conclusion
As UX designers, it’s important to do thorough research and learn as much as you can about your competition before you begin your product design. Studying the landscape of competitors through different frameworks not only improves your design decisions but also helps you deliver a better product solution. By using UX competitive analysis, you can leverage your findings to ultimately deliver a superior product that builds value in your brand.
About the author
Kim Purcell is a content writer at Neil Patel Digital. Her extensive background includes writing and editing for publishing, IT, and digital media industries, with a special focus on multimedia content and product development.