What’s in InVision’s design maturity study?
TL;DR version

You can find the full report here.
What is design maturity? According to the recent study produced by InVision, it’s the extent to which businesses incorporate design practices in their overall system. Those that assimilate design thinking into their processes are more likely to see positive outcomes concerning product, position, and profit (7).
InVision, realizing the need to understand where companies stand in terms of the way they view design, utilize their designers, and understand the design thinking process, produced an extensive report labeled “The New Design Frontier: The widest-ranging report to date examining design’s impact on business.”
To understand how companies see design, InVision sent out a survey to over 2,200 organizations around the world (spanning from large enterprises and governmental organizations to small businesses and NGOs) to explore how they create better business outcomes with design (4). In the survey, they included asks such as the company demographics, stakeholder involvement, practices, and etc.
They created the survey by “auditing existing design maturity models, consulted industry analysts, conducted qualitative research with designers in the field” as well as consulting InVision’s own experts. Through this survey, they were able to create a maturity model that expresses the trends of design in these companies.
The following is a TL;DR (too long; didn’t read) version of the 43 page report condensed into bullet points and notes for your reading convenience.
1. Analytics
The report starts off with a blunt fact:
“Companies with high design maturity see cost savings, revenue gains, and brand and market position improvements as a result of their design efforts” (2).
‘Maturity’ in the report is defined as the organizations relationship with design and the extent to which the organization utilizes design in conjunction to their business model.
In the report, they claim that business impact is “substantially propelled” through design, and companies that rank higher on the design maturity model are more likely to save and see gains in revenue as well as overall market growth.
In the companies with the most emphasis on design, the report notes, design is merged seamlessly with the product development process itself, as well as with key stakeholders and the roadmap of the product (7).

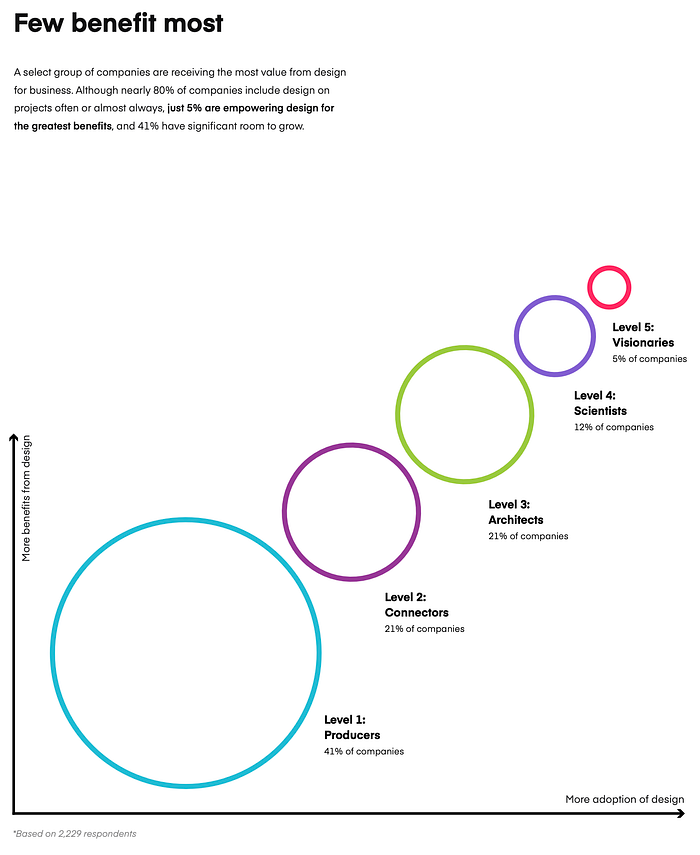
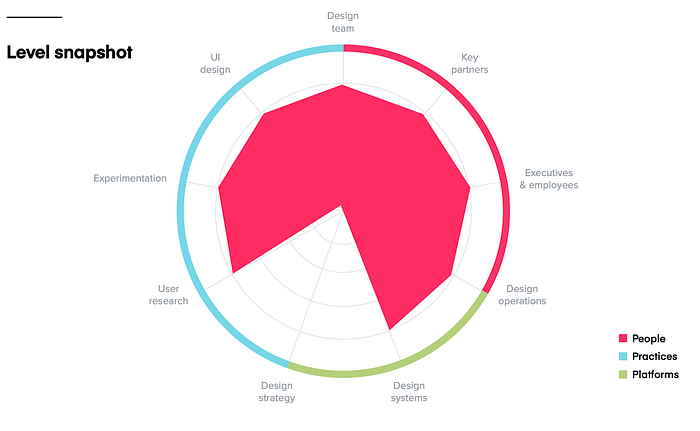
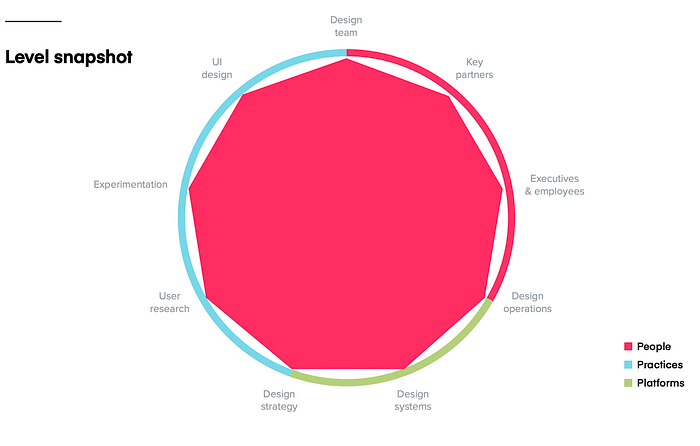
In their study of companies, InVision found that 80% of companies include design on projects almost or always, but only 5% of those companies were “empowering design for the greatest benefits” and 41% “have significant room to grow” (11).
However, the report emphasized that the quantity of a team did not equal its quality.
“Design team size isn’t always an indication of business impact or a company’s design maturity” (13).
There are large teams that measured low on design maturity, and small teams that ranked high. Larger organizations have a harder time finding design maturity — if you’re a larger organization, you have to be thoughtful and proactive on how you integrate design into the business, focusing on strategy, collaboration, experimentation and quality (33).
The key to design maturity is in the process — the integration of design thinking into the entirety of the companies structures.
2. Design Maturity
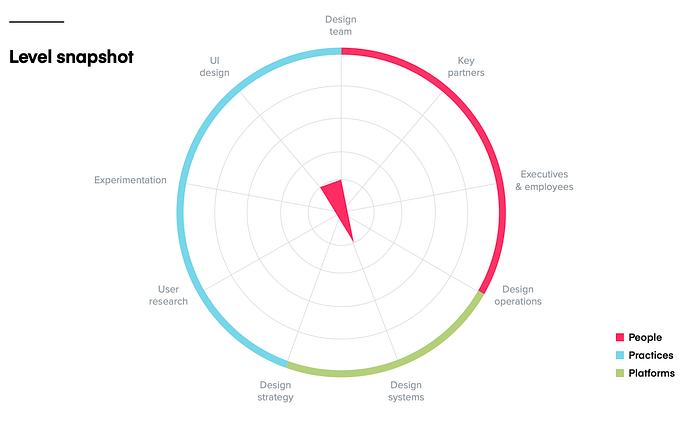
Level One: Producers (41% of companies)
Level one companies focus specifically on visual design, but have a hard disconnect between what the designers are attempting to design and what the developers are attempting to build. There is a lack of cohesion and communication between them, and that reflects in the rather bumpy process of product development.
In order to level up, the report suggests that incorporating more user research into the design stage of the product, as well as focusing on communicating and collaborating efficiently, would result in a more cohesive flow. Some tools to level up include — collaborating across teams digitally and in-person, developing a user research program, and constructing the perspective of design to go far more in depth than just the user interface. (17)
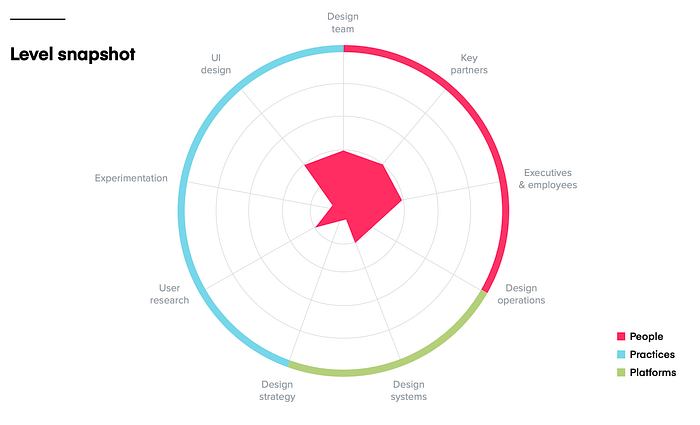
Level Two: Connectors (21% of companies)
Level two companies are connectors — meaning they’re collaborative, have joint working sessions, and use tools to work with peers that are not designers. They focus on user research, user stories, and user testing more heavily compared to level one companies. These companies are slowly gaining more user-informed design and momentum, are discussing with key stakeholders, and their success in collaborating is bringing demand to the company.
To merge into a level three company, it’s essential that these companies focus on design systems, hire driven employees to fill the systematic process, and create an inclusive environment for designers, engineers, and product managers on creating a design system thats scalable. (19)
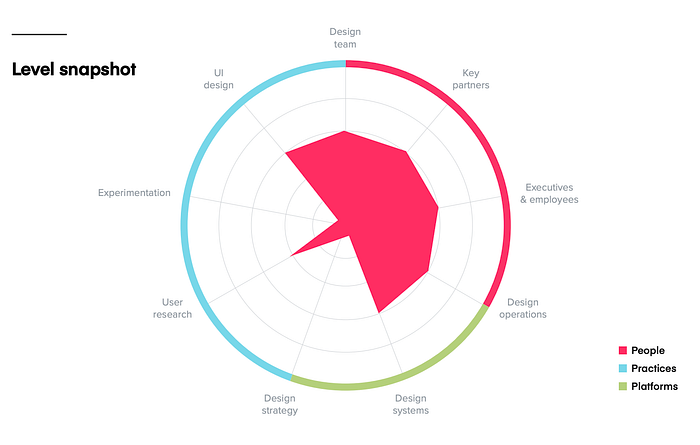
Level Three: Architects (21% of companies)
Level three companies are characterized by daily stand-ups, a routine on planning and briefing, and consistent written documentation. They present shared ownership, have distinct roles and accountability, and organized documentation of the process they follow. Because they follow this disciplinary design process, their design “can support more complex product ecosystems and integrate itself into equally complex internal operating structures” (21).
Level three companies tend to have larger design teams due to the aforementioned operating structures. At this point in the game, it’s essential that companies clarify what it means to be a designer vs. an engineer vs. a product manager, and create a variety of ways that the handoff between design and development can be documented.
To level up, they must focus on how they experiment, develop hypotheses, run tests, and measure the results of those tests.
Level Four: Scientists (12% of companies)
Level four companies are data-driven design experts. They are analytical, experiment using sophisticated methods, and measure their results consistently (22).
They have the very beginnings of design strategy incorporated into their growth process, and use it while focusing on developing their vision. The design team is empowered to pursue important opportunities and executives are wholly part of the process. The design operations are fully formalized. They’re known to delve into concept testing, A/B tests, as well as analytics.
“Design became a learning and decision making tool, teams use data driven approaches and integrate ideation, experiments and analytics — its super transformative for design-driven business benefits, producing efficiency, saving costs, and project-specific benefits” (23)
To level up, companies must focus on making design core to their overall business strategy, and apply the tools they use in design to new challenges they encounter, using the design thinking process and bringing it to the boardroom (22).
Level Five: Visionaries (5% of companies)
Level five companies are the visionaries. What makes them so is that they use the design thinking process in product development and apply it to their internal business strategies. “Its a lens through which they use exploratory research strategies and techniques, trends and foresight that assess the product market fit, and deliver unified cross-platform strategies” (25).
They report that their design has the widest range of impact — from employee productivity, growth, to innovative pursuits. They actively look out for trends in the market, test product market fit, and use design strategies across platforms.
They use design technology to redefine the standards for what customer experience and the business process even is. The report explains that because of their sophisticated methods, all other companies should look at level five companies to understand the various challenges that come their way, and be dedicated in creating processes that they can create these level five practices in their own companies (25).
InVision also offers a process in which to access more help in advancing your companies maturity level.
3. Industry and Region
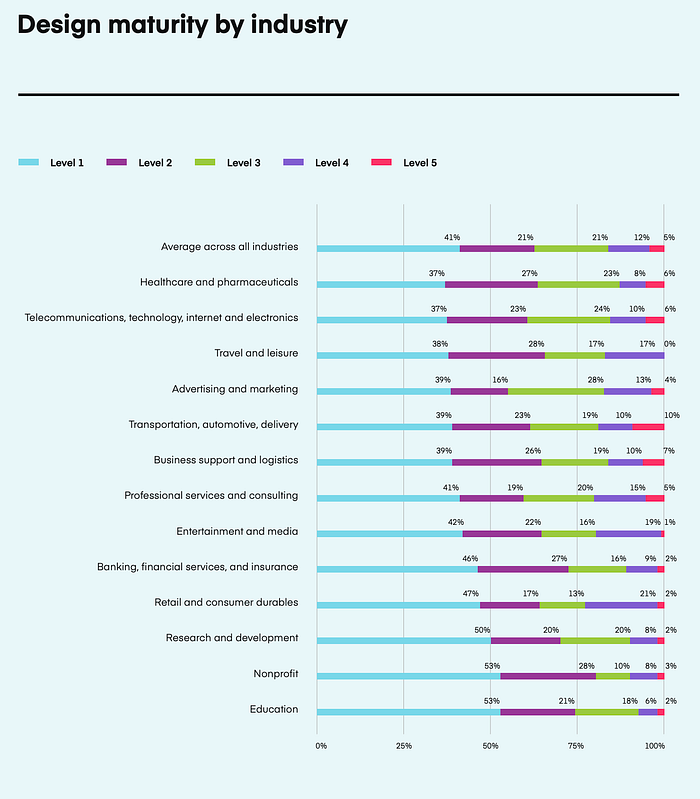
The above graphic is a depiction of companies that fall into each industry, the data significantly portraying the majority of all companies in industries spanning from education to healthcare as producers and connectors (levels one and two).
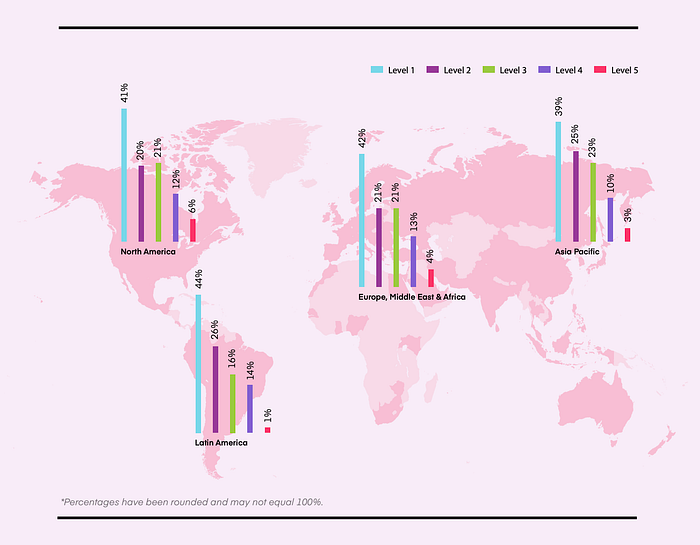
In terms of location, the report states that design maturity is an even distribution across the world, with low maturity companies ranking as plenty across the regions and “significantly fewer high maturity companies in every region” (34). Europe and North America, which are similar in their maturity distribution, lead the rest. Asia Pacific is on the middle ground in which they don’t fall into either end of the spectrum, and Latin America becomes the region that is least mature (34).
Opinion and Conclusions:
The above was a simple summary of the findings of InVision’s 43 page report. In terms of research, it was organized intuitively in a fashion in which they took you through the findings of their extensive survey from the survey analysis to the maturity model that they developed. Understanding the concepts they were trying to portray was comprehensible, and the visuals they employed to communicate their data helped in relaying the overall message.
However, reading the report with an academic eye, I felt myself searching for the specific questions they asked and the companies surveyed in the report. In my search, I found a small blurb with the following information on their limitations:
Survey participants were selected from InVision’s contact database, which includes current clients, past clients, and people who have signed up for marketing communications. That means this isn’t a random sample. The analysis is based on self-reported data from individuals who may have biased responses or may not have a complete understanding of design practices in their company (6).
These limitations are critical in understanding the report itself. If all participants came from InVision’s contact database, it means that the data is substantially skewed towards those that employ InVision’s services and softwares as part of their companies overall process. If, however, they are in the market with InVision’s competitors, then their data and insight is completely disregarded by the mere fact that it is unavailable in the “analytical rigor” with which InVision reported. Like the quote above says, customers of InVision would easily have a bias towards providing favorable responses to InVision.
The last sentence, which admits that the self-reported data might be from individuals that might not have a complete understanding of design practices is also problematic — to judge a company based off a maturity model by individuals that don’t know how to relay their design practices seems erroneous. Also, being unable to easily access any companies and the questionnaire itself created more skepticism than not for a design maturity report.
In the regional and size analysis of their industry report, there are two possible areas of concern: if the companies surveyed are only InVision clientele, than the data isn’t reflective on regional design maturity simply by the fact that they could easily use a different service than InDesign. Latin America, then, could possibly have high levels of design maturity that we know nothing about.
At the same time, comparing a developed industry in the West to areas that are notoriously underdeveloped raises issues as well. Europe, Middle East, and Africa, were grouped together as if comparable in terms of industry and infrastructural development. The information from Europe cannot correlate with information from the Middle East, a region undergoing political turmoil and unable to influence their industrial development in favor of social conflict. China, grouped with Asia Pacific, is known to censor many Western-created softwares at different points of time, and employ their own methodology for design innovation. In this, again, is data that does not deem safe to draw conclusions from.
If I were to suggest any improvements, it would be to focus on design as an entity greater than the network of InVision itself, and for the authors and contributors to discuss rigorous tactics in which they are able to go beyond self-reported data in companies (which usually leans more towards bias) to what the actual employed design methods are. If truly interested in assisting the world in developing the way it sees design, it would be essential to carefully extract data from specific regions at first, and see how that data is reflective of greater trends in the design community.
Read the report in its entirety.
Find me on LinkedIn!
The report was written by Leah Buley, with contributions by Chris Avore, Stephen Gates, Stephanie Gonzalez, Rob Goodman, and Aarron Walter.
This article is not affiliated with InVision or any of the above authors/contributors.
All pictures are found from InVision’s report.

